TiledViz : web tool for tiled visualisation
Discover the BrainTwister and TileViz applications on the Mandelbrot image wall.
Scientific and technological objectives of this platform.
With the exponential increase in the power of HPC computers, it is now reasonable to run numerous simulation scenarios simultaneously to analyse parametric variations on large models, such as global climate models. Most of the time, these models can be analysed using reductions along a number of dimensions, but 2D or 3D analysis cannot be carried out without visualising the results over thirty (or even a hundred) simulations, which often means printing them out.
We have started to build a web application that can retrieve sets of simulation results from a post-processing server and display them in a pre-determined order by analysing the metadata associated with the images. This application can sort images to group them together, perform selective sorting based on variables extracted during the pre-processing phase and annotate thumbnails. Selective zooming and row/column swapping functions add interactivity to the image display. Finally, the final sort can be saved and reused.
We want to take advantage of our Mandelbrot high-resolution visualisation platform to display a much larger amount of data and interact with it in a collaborative way. To do this, we need to further develop this application and integrate it with the WildOS middleware developed by Michel Beaudouin-Lafon at the LRI. The application will be designed in partnership with three teams from three different disciplines, but is potentially of interest to a wide range of disciplines.
BrainTwister on the Mandelbrot image wall
The morphology of the folds in the cerebral cortex is unique to each human being, just like fingerprints. The patterns appear in utero when the architecture of the cortex is being put in place. An accumulation of observations concerning genetic pathologies or developmental epilepsy have shown massive anomalies in these patterns. To identify more subtle anomalies associated with major psychiatric syndromes, it is necessary to model the normal variability of these patterns in the general population.
For 25 years, this has been one of the research programmes of Neurospin’s image analysis laboratory. This programme is in the process of compiling a dictionary of all the patterns frequently observed in the general population, based on tens of thousands of brains. Once this dictionary has been compiled, it will provide an operational definition of abnormal patterns that may be associated with an increased risk of developmental pathologies and contribute to their early diagnosis.
For many years, this research programme has been hampered by the difficulty of simultaneously visualising a large number of brains. This leads to the sub-optimality of the learning bases built up by the human experts responsible for feeding the computer learning tools at the heart of this research programme. It is against this backdrop that a feasibility study has been carried out over the last few years in collaboration between Neurospin and DIGITEO Moulon’s LRI, as part of the DIGISCOPE equipex.
The BrainTwister prototype we have developed has convinced us that screen wall technology is an essential part of our research programme. We are now looking to convert this prototype into an operational platform used on a massive scale for Neurospin’s research and eventually by the national CATI platform, which is responsible for exploiting Neurospin’s tools in large cohorts dedicated to clinical research. This need naturally turned to the Maison de la Simulation, whose vocation is to produce this type of tool. It quickly became clear that the screen wall could be used in other areas of climate and astrophysics research.
The BrainVisa platform has been developed by the UNATI laboratory. It contains all the analysis tools resulting from the laboratory’s research, and in particular the tools for analysing the morphology of cortical folds. It also contains Anatomist, a visualisation software package dedicated to brain imaging data. Anatomist displays various interactive 3D representations of MRI data, brain meshes and cortical sulci. It represents the sulci extracted by the analysis tools, and shows the identification of cortical patterns in different colours. An interactive module allows these identifications to be changed or corrected manually. This is the tool used to develop and enrich the learning bases used to train the automatic identification systems. Anatomist is modular software and includes programming libraries in C++ and Python, so it can be used to build dedicated visualisation applications for specific uses, making it easy to integrate into TiledViz or, previously, BrainTwister.
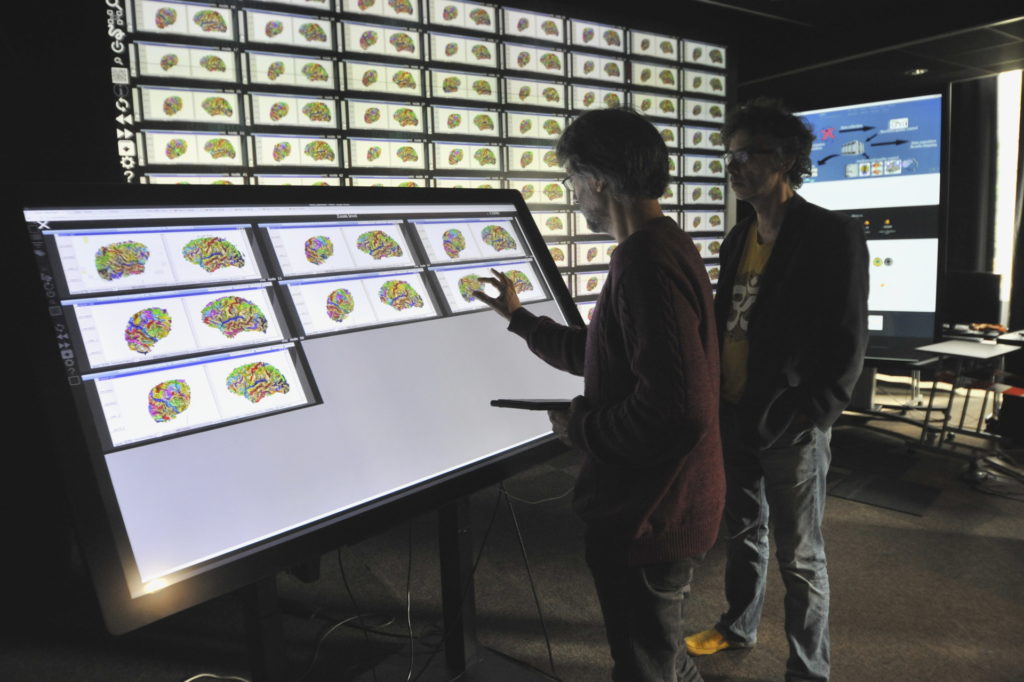
The BrainTwister application was developed as part of a collaboration between Neurospin’s UNATI laboratory and DIGITEO Moulon’s LRI with an ex-situ team from INRIA. This application enables pairs of brain hemispheres and their sulci to be visualised with anatomist on the LRI’s DIGISCOPE wilder image wall.
Interaction with the video wall and the data used the wilder platform’s infrared system. This interaction enabled a subset of the pairs to be selected for synchronised rotation, but did not enable the elements displayed to be sorted – an essential feature for the UNATI team to carry out its research. Indeed, understanding the anatomy of cortical folds and their variability is limited by the impossibility of viewing all the brains at our disposal and comparing them visually. Using the Mandelbrot image wall at the MDLS will make it possible to display a fairly large number of brains and compare them visually during work sessions involving several specialist researchers who can discuss them in front of the display. Brains with locally similar conformations can be grouped together and we hope that this will make it possible to identify fine categories of patterns in sub-populations. This initially manual (or visual) work will eventually be facilitated by automatic clustering tools, which will also need to be validated visually. Sorting the brains and displaying them side by side, as well as synchronised rotation, are essential for this work.
BrainTwister is a node-webkit platform application called WildOS, developed by Michel Beaudouin-Lafon’s team at the LRI. This application launches an instance of Anatomist on each server in the cluster, enabling it to be displayed at very high resolution on the Université Paris-Sud Wilder video wall, which displays a total of one hundred million pixels. For each of these instances, several pairs of hemispheres are displayed according to the total resolution of the screens connected to the machine.
This implementation reduces the number of client/server connections needed to manipulate 3D visualisations within Anatomist instances. But it does not allow a pair to be moved to compare it with one or more others located at a distance from the wall of images (which is 6 metres wide for Wilder and 4.3 m for Mandelbrot and its 33 million pixels).
 TiledViz
After installing the WildOS platform and its BrainTwister application (which is no longer maintained at the LRI), on the Mandelbrot platform at the Maison de la Simulation, located at DIGITEO Saclay, we decided to develop an application independent of WildOS that would be generic for different sets of simulations or experiments, would allow the same interactions as in BrainTwister, but would lift this lock for sorting the outputs on our video wall. This TiledViz application under development now exists and a demonstrator embeds Anatomist and displays the interactive results on the Mandelbrot video wall.
It should be noted that our wall is not equipped with ART technology (infrared cameras allowing the positioning of a user equipped with reflectors), nor multi-touch, like the Wilder wall, but that we are going to equip it with an interactive table, in addition to the tablets and the control PC already present. The design of the Mandelbrot room (see http://www.maisondelasimulation.fr/Visualisation.php) is geared towards collaborative working in a space of twenty square metres in front of the video wall. From our point of view, the immersive aspect of certain visualisation platforms means that users have to learn a great deal and use their own equipment to interact with the wall.
We regularly use the VNC servers at the Maison de la Simulation to interact with the video wall on the internal network of the Mandelbrot cluster. We also use this technology via the CEA’s wifi network using an ssh tunnel to get low-resolution encrypted feedback from the video wall to our tablet via the forticlient key server.
To solve the serious problem of adapting this application to display graphical output from multiple instances of a tool like Anatomist on the video wall, with these outputs moving from one rendering node to another, we chose Docker container technology exporting VNC streams through secure tunnels.
Containers are lightweight Linux virtual machines that have a different system from the host machine, but share the kernel and therefore the peripherals of the host machine. This gives immediate advantages: there is very little loss of efficiency when rendering large amounts of data in 3D, the duplication of containers on the same machine is shared in memory, communications are encapsulated and therefore secure within each container, and external communication ports are controlled. Input/output on defined directories (location of databases) is controlled because it can be mounted as read-only in the container. Finally, this solution is generic enough to be adapted to many other situations and deported to remote computing machines, if the systems engineers have enabled virtualisation.
At the Maison de la Simulation, we have produced an initial model for the tiled display of climate output results, in collaboration with a team from LSCE and CLIMAF between IPSL and Météo France for the display of still images, but with the use of metadata for the interactive sorting of these images.This web application is dedicated to desktop browsers and is designed to be added as an option for post-processing web services for climatological databases.
This application, developed with a trainee from the Ecole des Mines Saint Etiennes, has been a success and several work sessions have taken place in front of the Mandelbrot wall using the WildOS platform as a very high-resolution browser on the image wall.
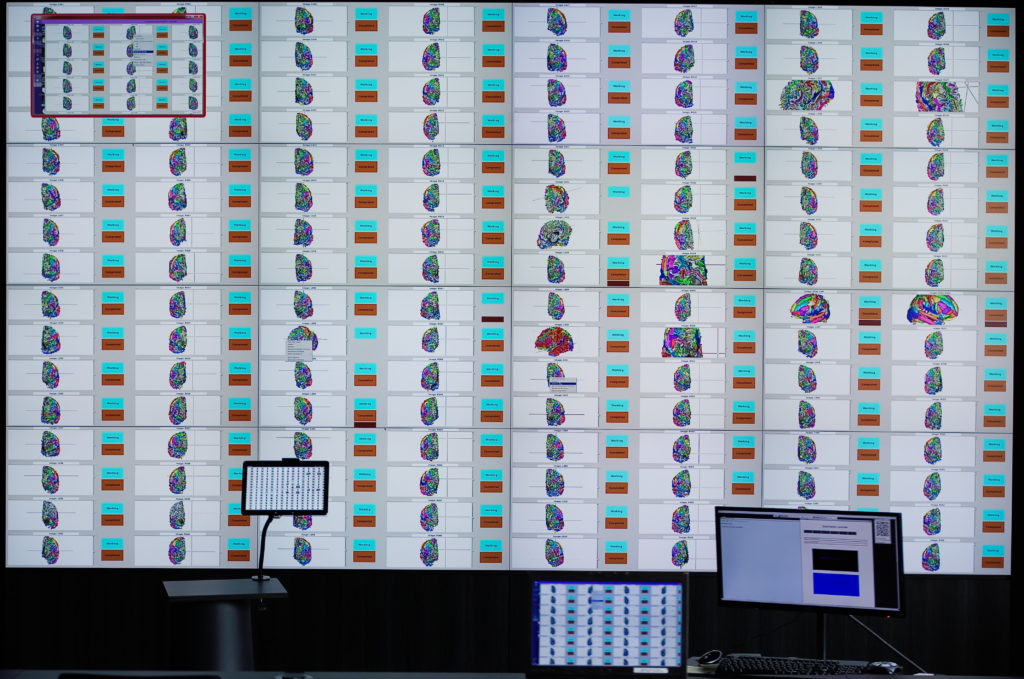
This implementation of TiledViz with containers allows us to launch a series of containers (up to a hundred) on a very large shared-memory server in our Mandelbrot cluster and to view the output via VNC streams on WildOS clients in the full resolution of our video wall. Here is a photo of a first tiled series sorting application – called TiledViz – of output from an Anatomist application on a Neurospin brain database.
Launching the client application is automated. What’s more, it now supports scaling because the containers are deployed on several graphics nodes. They have to be deployed on dedicated resources. What’s more, the flows arrive on all the clients. We have therefore put in place an easily adaptable client-server mechanism to manage the flows and trigger the launch of remote containers according to the movement of elements in the clients.